#build the training and test data
X_train,X_test,y_train,y_test = train_test_split(
    clean,
    labels,
    stratify=labels,
    test_size=0.2,
    random_state=9999
)

X_train_npc,X_test_npc,y_train,y_test = train_test_split(
    clean_npc,
    labels,
    stratify=labels,
    test_size=0.2,
    random_state=9999
)Appendix E — Decision Tree Code
E.1 Label Encoded Data
| derived_sex | preapproval | open-end_line_of_credit | loan_amount | loan_to_value_ratio | interest_rate | total_loan_costs | origination_charges | discount_points | lender_credits | ... | co-applicant_ethnicity_Not Applicable | co-applicant_ethnicity_No Co-applicant | aus_Desktop Underwriter | aus_Loan Prospector/Product Advisor | aus_TOTAL Scorecard | aus_GUS | aus_Other | aus_Internal Proprietary | aus_Not applicable | aus_Exempt | |
|---|---|---|---|---|---|---|---|---|---|---|---|---|---|---|---|---|---|---|---|---|---|
| 142289 | 3 | 0 | 1 | 1 | 2 | 3 | 1 | 1 | 1 | 1 | ... | 0 | 0 | 1 | 0 | 0 | 0 | 0 | 0 | 0 | 0 |
| 174168 | 0 | 0 | 1 | 2 | 2 | 3 | 1 | 1 | 1 | 1 | ... | 0 | 1 | 1 | 0 | 0 | 0 | 0 | 0 | 0 | 0 |
| 106229 | 1 | 1 | 1 | 1 | 2 | 2 | 1 | 1 | 1 | 1 | ... | 0 | 0 | 1 | 0 | 0 | 0 | 0 | 0 | 0 | 0 |
| 30766 | 0 | 1 | 1 | 3 | 2 | 2 | 3 | 1 | 1 | 1 | ... | 0 | 1 | 1 | 1 | 0 | 0 | 1 | 0 | 0 | 0 |
| 34556 | 0 | 1 | 1 | 1 | 2 | 2 | 1 | 1 | 1 | 1 | ... | 0 | 1 | 1 | 1 | 0 | 0 | 1 | 0 | 0 | 0 |
| 60130 | 0 | 1 | 0 | 1 | 1 | 2 | 1 | 1 | 1 | 1 | ... | 0 | 1 | 0 | 0 | 0 | 0 | 0 | 0 | 1 | 0 |
| 114480 | 0 | 0 | 1 | 1 | 4 | 2 | 1 | 1 | 1 | 1 | ... | 0 | 1 | 1 | 0 | 0 | 0 | 0 | 0 | 0 | 0 |
| 61174 | 2 | 1 | 1 | 1 | 2 | 2 | 1 | 1 | 1 | 1 | ... | 0 | 1 | 0 | 1 | 0 | 0 | 0 | 1 | 0 | 0 |
| 131619 | 2 | 0 | 1 | 1 | 4 | 2 | 1 | 1 | 1 | 1 | ... | 0 | 0 | 1 | 0 | 0 | 0 | 0 | 0 | 0 | 0 |
| 77029 | 2 | 1 | 1 | 2 | 2 | 2 | 1 | 1 | 1 | 1 | ... | 0 | 1 | 1 | 1 | 0 | 0 | 0 | 1 | 0 | 0 |
10 rows × 100 columns
| preapproval | open-end_line_of_credit | loan_amount | loan_to_value_ratio | interest_rate | total_loan_costs | origination_charges | discount_points | lender_credits | loan_term | ... | tract_median_age_of_housing_units | company | aus_Desktop Underwriter | aus_Loan Prospector/Product Advisor | aus_TOTAL Scorecard | aus_GUS | aus_Other | aus_Internal Proprietary | aus_Not applicable | aus_Exempt | |
|---|---|---|---|---|---|---|---|---|---|---|---|---|---|---|---|---|---|---|---|---|---|
| 142289 | 0 | 1 | 1 | 2 | 3 | 1 | 1 | 1 | 1 | 2 | ... | 2 | 3 | 1 | 0 | 0 | 0 | 0 | 0 | 0 | 0 |
| 174168 | 0 | 1 | 2 | 2 | 3 | 1 | 1 | 1 | 1 | 2 | ... | 1 | 3 | 1 | 0 | 0 | 0 | 0 | 0 | 0 | 0 |
| 106229 | 1 | 1 | 1 | 2 | 2 | 1 | 1 | 1 | 1 | 2 | ... | 1 | 2 | 1 | 0 | 0 | 0 | 0 | 0 | 0 | 0 |
| 30766 | 1 | 1 | 3 | 2 | 2 | 3 | 1 | 1 | 1 | 2 | ... | 1 | 1 | 1 | 1 | 0 | 0 | 1 | 0 | 0 | 0 |
| 34556 | 1 | 1 | 1 | 2 | 2 | 1 | 1 | 1 | 1 | 2 | ... | 1 | 1 | 1 | 1 | 0 | 0 | 1 | 0 | 0 | 0 |
| 60130 | 1 | 0 | 1 | 1 | 2 | 1 | 1 | 1 | 1 | 2 | ... | 2 | 0 | 0 | 0 | 0 | 0 | 0 | 0 | 1 | 0 |
| 114480 | 0 | 1 | 1 | 4 | 2 | 1 | 1 | 1 | 1 | 1 | ... | 1 | 3 | 1 | 0 | 0 | 0 | 0 | 0 | 0 | 0 |
| 61174 | 1 | 1 | 1 | 2 | 2 | 1 | 1 | 1 | 1 | 2 | ... | 1 | 0 | 0 | 1 | 0 | 0 | 0 | 1 | 0 | 0 |
| 131619 | 0 | 1 | 1 | 4 | 2 | 1 | 1 | 1 | 1 | 1 | ... | 3 | 3 | 1 | 0 | 0 | 0 | 0 | 0 | 0 | 0 |
| 77029 | 1 | 1 | 2 | 2 | 2 | 1 | 1 | 1 | 1 | 2 | ... | 1 | 4 | 1 | 1 | 0 | 0 | 0 | 1 | 0 | 0 |
10 rows × 33 columns
dt_pc,dt_npc = DecisionTreeClassifier(max_depth=4),DecisionTreeClassifier(max_depth=4)
# re-fit using the new data on the previous models
dt_pc.fit(X_train,y_train)
dt_npc.fit(X_train_npc,y_train)
#generate predictions
y_pred = dt_pc.predict(X_test)
y_pred_npc = dt_npc.predict(X_test_npc)
import graphviz
from sklearn import tree
dot_data = tree.export_graphviz(
dt_npc,
class_names = ['deny','approve'], #labels.unique(), #
feature_names = X_test_npc.columns, #the columns
out_file=None
)
graph = graphviz.Source(dot_data)
graph

#display summarized classification results
results = pd.DataFrame({
'Model':[],
'Data':[],
'Accuracy':[],
'Precision':[],
'Recall':[],
'F1':[],
'ROC-AUC':[]
})
results.loc[len(results)] = {
'Model':'Decision Tree',
'Data':'With Protected Classes',
'Accuracy':accuracy_score(y_test,y_pred),
'Precision':precision_score(y_test,y_pred),
'Recall':recall_score(y_test,y_pred),
'F1':f1_score(y_test,y_pred),
'ROC-AUC':roc_auc_score(y_test,y_pred)
}
results.loc[len(results)] = {
'Model':'Decision Tree',
'Data':'Without Protected Classes',
'Accuracy':accuracy_score(y_test,y_pred_npc),
'Precision':precision_score(y_test,y_pred_npc),
'Recall':recall_score(y_test,y_pred_npc),
'F1':f1_score(y_test,y_pred_npc),
'ROC-AUC':roc_auc_score(y_test,y_pred_npc)
}
display(results)| Model | Data | Accuracy | Precision | Recall | F1 | ROC-AUC | |
|---|---|---|---|---|---|---|---|
| 0 | Decision Tree | With Protected Classes | 0.909013 | 0.911677 | 0.989477 | 0.948985 | 0.711476 |
| 1 | Decision Tree | Without Protected Classes | 0.909013 | 0.911677 | 0.989477 | 0.948985 | 0.711476 |
#display summarized classification results - confusion matrices
import matplotlib.pyplot as plt
fig,axes=plt.subplots(nrows=1,ncols=2)
ConfusionMatrixDisplay(
confusion_matrix(
y_pred=y_pred,y_true=y_test
),
display_labels=['Deny','Approve']
).plot(ax=axes[0])
ConfusionMatrixDisplay(
confusion_matrix(
y_pred=y_pred_npc,y_true=y_test
),
display_labels=['Deny','Approve']
).plot(ax=axes[1])
axes[0].set_title('With Protected\nClasses')
axes[1].set_title('Without Protected\nClasses')
plt.suptitle("Confusion Matrices - Decision Trees")
plt.tight_layout()
plt.show()
E.1.1 Dropping debt to income ratio
import graphviz
from sklearn import tree
dot_data = tree.export_graphviz(
    dt_npc,
    class_names = ['deny','approve'], #labels.unique(), #
    feature_names = X_test_npc.columns, #the columns
    out_file=None
)
graph = graphviz.Source(dot_data)
graph
'imgs\\dt1npc.png'
'imgs\\dt1pc.png'#display summarized classification results
results = pd.DataFrame({
'Model':[],
'Data':[],
'Accuracy':[],
'Precision':[],
'Recall':[],
'F1':[],
'ROC-AUC':[]
})
results.loc[len(results)] = {
'Model':'Decision Tree',
'Data':'With Protected Classes',
'Accuracy':accuracy_score(y_test,y_pred),
'Precision':precision_score(y_test,y_pred),
'Recall':recall_score(y_test,y_pred),
'F1':f1_score(y_test,y_pred),
'ROC-AUC':roc_auc_score(y_test,y_pred)
}
results.loc[len(results)] = {
'Model':'Decision Tree',
'Data':'Without Protected Classes',
'Accuracy':accuracy_score(y_test,y_pred_npc),
'Precision':precision_score(y_test,y_pred_npc),
'Recall':recall_score(y_test,y_pred_npc),
'F1':f1_score(y_test,y_pred_npc),
'ROC-AUC':roc_auc_score(y_test,y_pred_npc)
}
display(results)| Model | Data | Accuracy | Precision | Recall | F1 | ROC-AUC | |
|---|---|---|---|---|---|---|---|
| 0 | Decision Tree | With Protected Classes | 0.889389 | 0.897131 | 0.983439 | 0.938304 | 0.658499 |
| 1 | Decision Tree | Without Protected Classes | 0.889389 | 0.897131 | 0.983439 | 0.938304 | 0.658499 |
#display summarized classification results - confusion matrices
import matplotlib.pyplot as plt
fig,axes=plt.subplots(nrows=1,ncols=2)
ConfusionMatrixDisplay(
confusion_matrix(
y_pred=y_pred,y_true=y_test
),
display_labels=['Deny','Approve']
).plot(ax=axes[0])
ConfusionMatrixDisplay(
confusion_matrix(
y_pred=y_pred_npc,y_true=y_test
),
display_labels=['Deny','Approve']
).plot(ax=axes[1])
axes[0].set_title('With Protected\nClasses')
axes[1].set_title('Without Protected\nClasses')
plt.suptitle("Confusion Matrices - Decision Trees")
plt.tight_layout()
plt.show()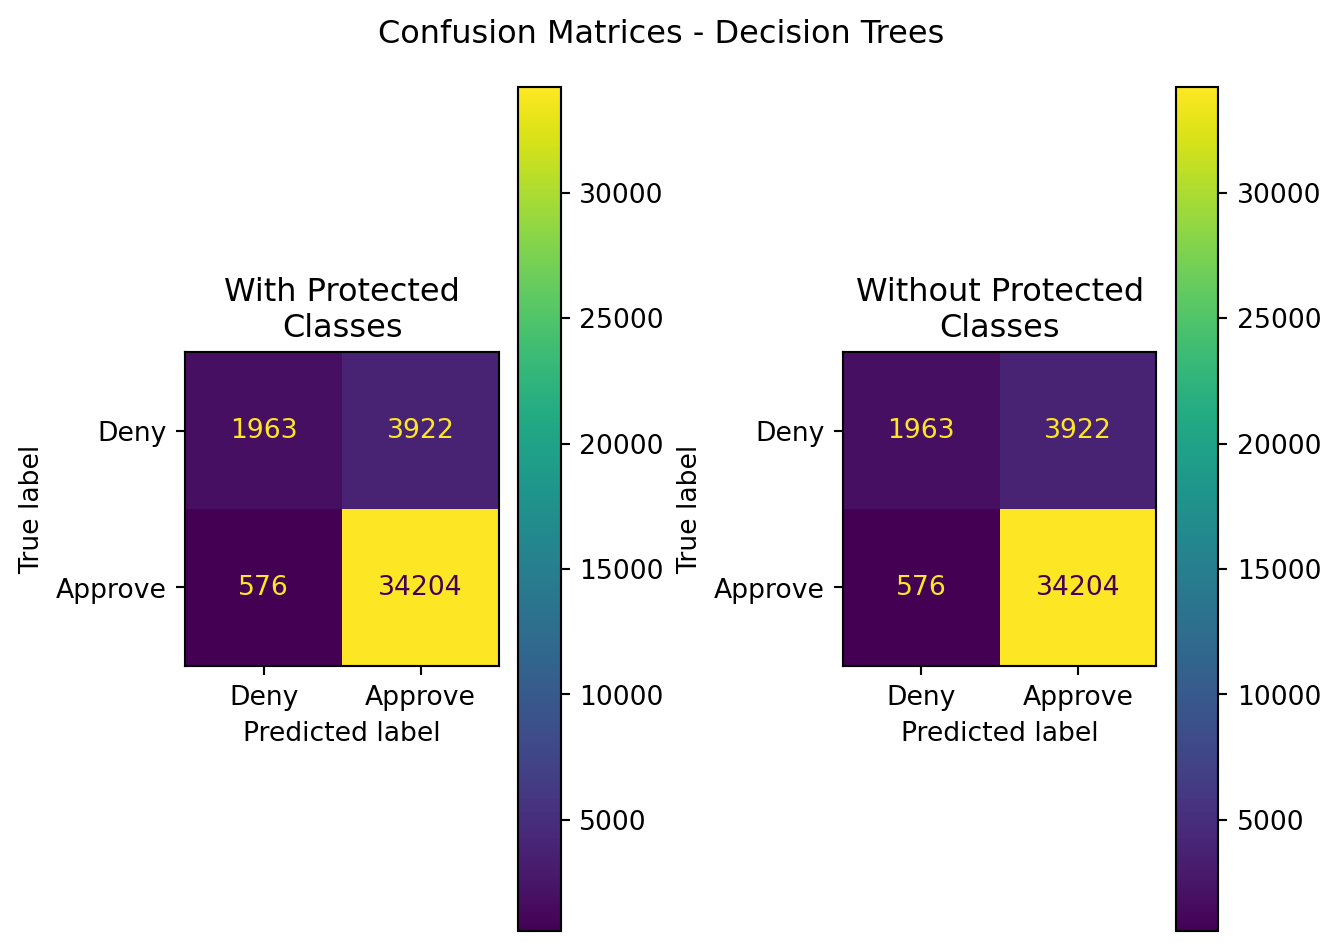
E.1.2 Dropping automated underwriting system columns…
import graphviz
from sklearn import tree
dot_data = tree.export_graphviz(
dt_npc,
class_names = ['deny','approve'], #labels.unique(), #
feature_names = X_test_npc.columns, #the columns
out_file=None
)
graph = graphviz.Source(dot_data)
graph

#display summarized classification results
results = pd.DataFrame({
    'Model':[],
    'Data':[],
    'Accuracy':[],
    'Precision':[],
    'Recall':[],
    'F1':[],
    'ROC-AUC':[]
})
results.loc[len(results)] = {
    'Model':'Decision Tree',
    'Data':'With Protected Classes',
    'Accuracy':accuracy_score(y_test,y_pred),
    'Precision':precision_score(y_test,y_pred),
    'Recall':recall_score(y_test,y_pred),
    'F1':f1_score(y_test,y_pred),
    'ROC-AUC':roc_auc_score(y_test,y_pred)
}
results.loc[len(results)] = {
    'Model':'Decision Tree',
    'Data':'Without Protected Classes',
    'Accuracy':accuracy_score(y_test,y_pred_npc),
    'Precision':precision_score(y_test,y_pred_npc),
    'Recall':recall_score(y_test,y_pred_npc),
    'F1':f1_score(y_test,y_pred_npc),
    'ROC-AUC':roc_auc_score(y_test,y_pred_npc)
}

display(results)| Model | Data | Accuracy | Precision | Recall | F1 | ROC-AUC | |
|---|---|---|---|---|---|---|---|
| 0 | Decision Tree | With Protected Classes | 0.863593 | 0.863495 | 0.998332 | 0.926031 | 0.532811 |
| 1 | Decision Tree | Without Protected Classes | 0.863593 | 0.863495 | 0.998332 | 0.926031 | 0.532811 |
#display summarized classification results - confusion matrices

import matplotlib.pyplot as plt
fig,axes=plt.subplots(nrows=1,ncols=2)

ConfusionMatrixDisplay(
    confusion_matrix(
        y_pred=y_pred,y_true=y_test
    ),
        display_labels=['Deny','Approve']
).plot(ax=axes[0])
ConfusionMatrixDisplay(
    confusion_matrix(
        y_pred=y_pred_npc,y_true=y_test
    ),
        display_labels=['Deny','Approve']
).plot(ax=axes[1])
axes[0].set_title('With Protected\nClasses')
axes[1].set_title('Without Protected\nClasses')
plt.suptitle("Confusion Matrices - Decision Trees")
plt.tight_layout()
plt.show()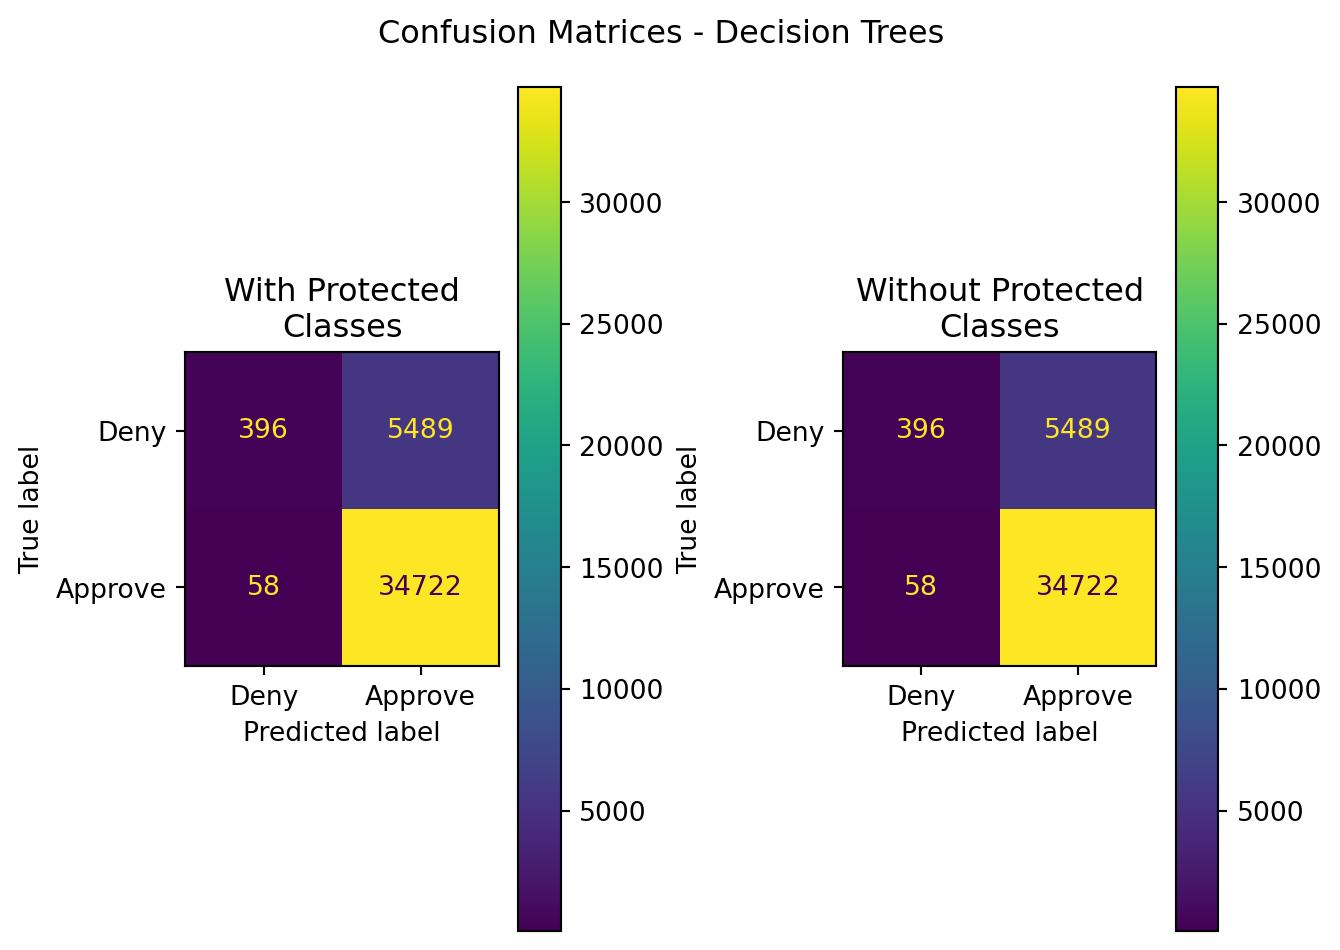
import graphviz
from sklearn import tree
dot_data = tree.export_graphviz(
    dt_npc,
    class_names = ['deny','approve'], #labels.unique(), #
    feature_names = X_test_npc.columns, #the columns
    out_file=None
)
graph = graphviz.Source(dot_data)
graph
dot_data = tree.export_graphviz(
    dt_pc,
    class_names = ['deny','approve'], #labels.unique(), #
    feature_names = X_test.columns, #the columns
    out_file=None
)
graph = graphviz.Source(dot_data)
graph
#randomization testing...
clean = pd.read_csv('../data/cnb_pc.csv')
clean_npc = pd.read_csv('../data/cnb_npc.csv')

np.random.seed(5505)
results = pd.DataFrame({
    'Model':[],
    'Data':[],
    'Accuracy':[],
    'Precision':[],
    'Recall':[],
    'F1':[],
    'ROC-AUC':[]
})
for i in range(500):
    r = np.random.randint(1,5000,1)[0]

    X_train,X_test,y_train,y_test = train_test_split(
        clean,
        labels,
        stratify=labels,
        test_size=0.2,
        random_state=r
    )

    X_train_npc,X_test_npc,y_train,y_test = train_test_split(
        clean_npc,
        labels,
        stratify=labels,
        test_size=0.2,
        random_state=r
    )
    dt_pc.fit(X_train,y_train)
    dt_npc.fit(X_train_npc,y_train)
    y_pred = dt_pc.predict(X_test)
    y_pred_npc = dt_npc.predict(X_test_npc)
    results.loc[len(results)] = {
        'Model':'Decision Tree (D=4)',
        'Data':'With Protected Classes',
        'Accuracy':accuracy_score(y_test,y_pred),
        'Precision':precision_score(y_test,y_pred),
        'Recall':recall_score(y_test,y_pred),
        'F1':f1_score(y_test,y_pred),
        'ROC-AUC':roc_auc_score(y_test,y_pred)
    }
    results.loc[len(results)] = {
        'Model':'Decision Tree (D=4)',
        'Data':'Without Protected Classes',
        'Accuracy':accuracy_score(y_test,y_pred_npc),
        'Precision':precision_score(y_test,y_pred_npc),
        'Recall':recall_score(y_test,y_pred_npc),
        'F1':f1_score(y_test,y_pred_npc),
        'ROC-AUC':roc_auc_score(y_test,y_pred_npc)
}results.to_csv('../data/dtRandTest.csv',index=False)#check for statistically significant differences in model performance
from statsmodels.stats.weightstats import ztest
tbl_pc = results[results['Data']=='With Protected Classes'].describe().T.reset_index()
tbl_npc = results[results['Data']=='Without Protected Classes'].describe().T.reset_index()
from scipy import stats
sig = pd.DataFrame({
'Stat':[],
'z-score':[],
'p-value':[],
'top performer':[],
'top mean':[],
'difference in means':[]
})
z_stat,p_value = ztest(
results.loc[results['Data']=='With Protected Classes']['Accuracy'],
results.loc[results['Data']=='Without Protected Classes']['Accuracy'],
)
scores = tbl_pc['index'].unique()
for score in scores:
z_stat,p_value = ztest(
results.loc[results['Data']=='With Protected Classes'][score],
results.loc[results['Data']=='Without Protected Classes'][score],
)
mu_pc, mu_npc = (
tbl_pc.loc[tbl_pc['index']==score,'mean'].iloc[0],
tbl_npc.loc[tbl_npc['index']==score,'mean'].iloc[0]
)
winner = np.select(
[
mu_pc < mu_npc,
mu_npc < mu_pc
],
[
'Without Protected Classes',
'With Protected Classes'
],
default='tie'
)
diff = np.abs(mu_pc-mu_npc)
m = max(mu_pc,mu_npc)
sig.loc[len(sig)] = {
'Stat':score,
'z-score':z_stat,
'p-value':p_value,
'top performer':winner,
'top mean':m,
'difference in means':diff
}
display(sig.style.hide(axis='index'))| Stat | z-score | p-value | top performer | top mean | difference in means |
|---|---|---|---|---|---|
| Accuracy | -0.063229 | 0.949584 | Without Protected Classes | 0.909842 | 0.000004 |
| Precision | -0.048038 | 0.961686 | Without Protected Classes | 0.912724 | 0.000002 |
| Recall | -0.045748 | 0.963511 | Without Protected Classes | 0.989174 | 0.000001 |
| F1 | -0.064089 | 0.948899 | Without Protected Classes | 0.949412 | 0.000002 |
| ROC-AUC | -0.049822 | 0.960264 | Without Protected Classes | 0.715086 | 0.000009 |
#visualize the output distributions
res = results.copy()
res = res.melt(id_vars=['Model','Data'],var_name='Metric',value_name='Score')
g = sns.FacetGrid(data=res,col='Metric',hue='Data',col_wrap=3)
g.map_dataframe(
    sns.kdeplot,
    x='Score'
)
g.add_legend(loc='lower right')
plt.suptitle("Distributions for Randomization of Training/Testing Data\nDecision Trees")
plt.tight_layout()
plt.show()